Climatic Impact-Drivers#
Overview#
These recipes and the corresponding diagnostic provide plotting routines for a selection of the Climatic Impact-Drivers defined in Elling et al. (2026). For each of these variables the model output is compared to observational datasets.
Available recipes and diagnostics#
Recipes are stored in recipes/climatic_impact-drivers
recipe_impacts_map.yml
recipe_impacts_timeseries.yml
Diagnostics are stored in diag_scripts/climatic_impact-drivers
multi_datasets_with_threshold.py: Monitoring diagnostic to optionally count days exceeding some threshold and plot multiple datasets on a map or timeseries.
User settings in recipe#
A full list of all possible configuration options that can be specified in the recipe is given at the beginning of the diagnostic script (see previous section).
The most relevant configuration options include:
Required settings
plots: type of plot that is created (map, timeseries)
Optional settings
options: additional pre-processing options that are applied. Available are:
threshold_conversion: Option to count the number of days on which a variable exceeds a certain threshold value. Requires the argument ‘threshold’ with the threshold that should be exceeded within this option. Allows additionally the argument ‘inverted’ to count the number of days where the variable attains a value below the given threshold and the argument ‘accumulated’ to correctly count the number of days if the given dataset is not daily and the given variable is accumulating over time.
Variables#
Any possible, but mainly designed for tasmin, tasmax, pr, snw, zostoga, tos, mlotst, rsds:
mlotst (ocean, monthly mean, longitude latitude time)
pr (atmos, daily mean, longitude latitude time)
rsds (atmos, daily mean, longitude latitude time)
snw (atmos, daily mean, longitude latitude time)
tasmax (atmos, daily max, longitude latitude time)
tasmin (atmos, daily min, longitude latitude time)
tos (ocean, monthly mean, longitude latitude time)
zostoga (ocean, monthly mean, longitude latitude time)
Observations and reformat scripts#
ESACCI-SNOW (snw)
ERA5 (tasmin, tasmax, pr, rsds - esmvaltool/recipes/cmorizers/recipe_daily_era5.yml)
ORAS5 (tos, mlotst)
References#
Elling, M.T., Ruane, A.C., De Mel, M. et al. An impact-driven framework for climate model evaluation. Climatic Change 179, 65 (2026). https://doi.org/10.1007/s10584-026-04157-w
Example plots#
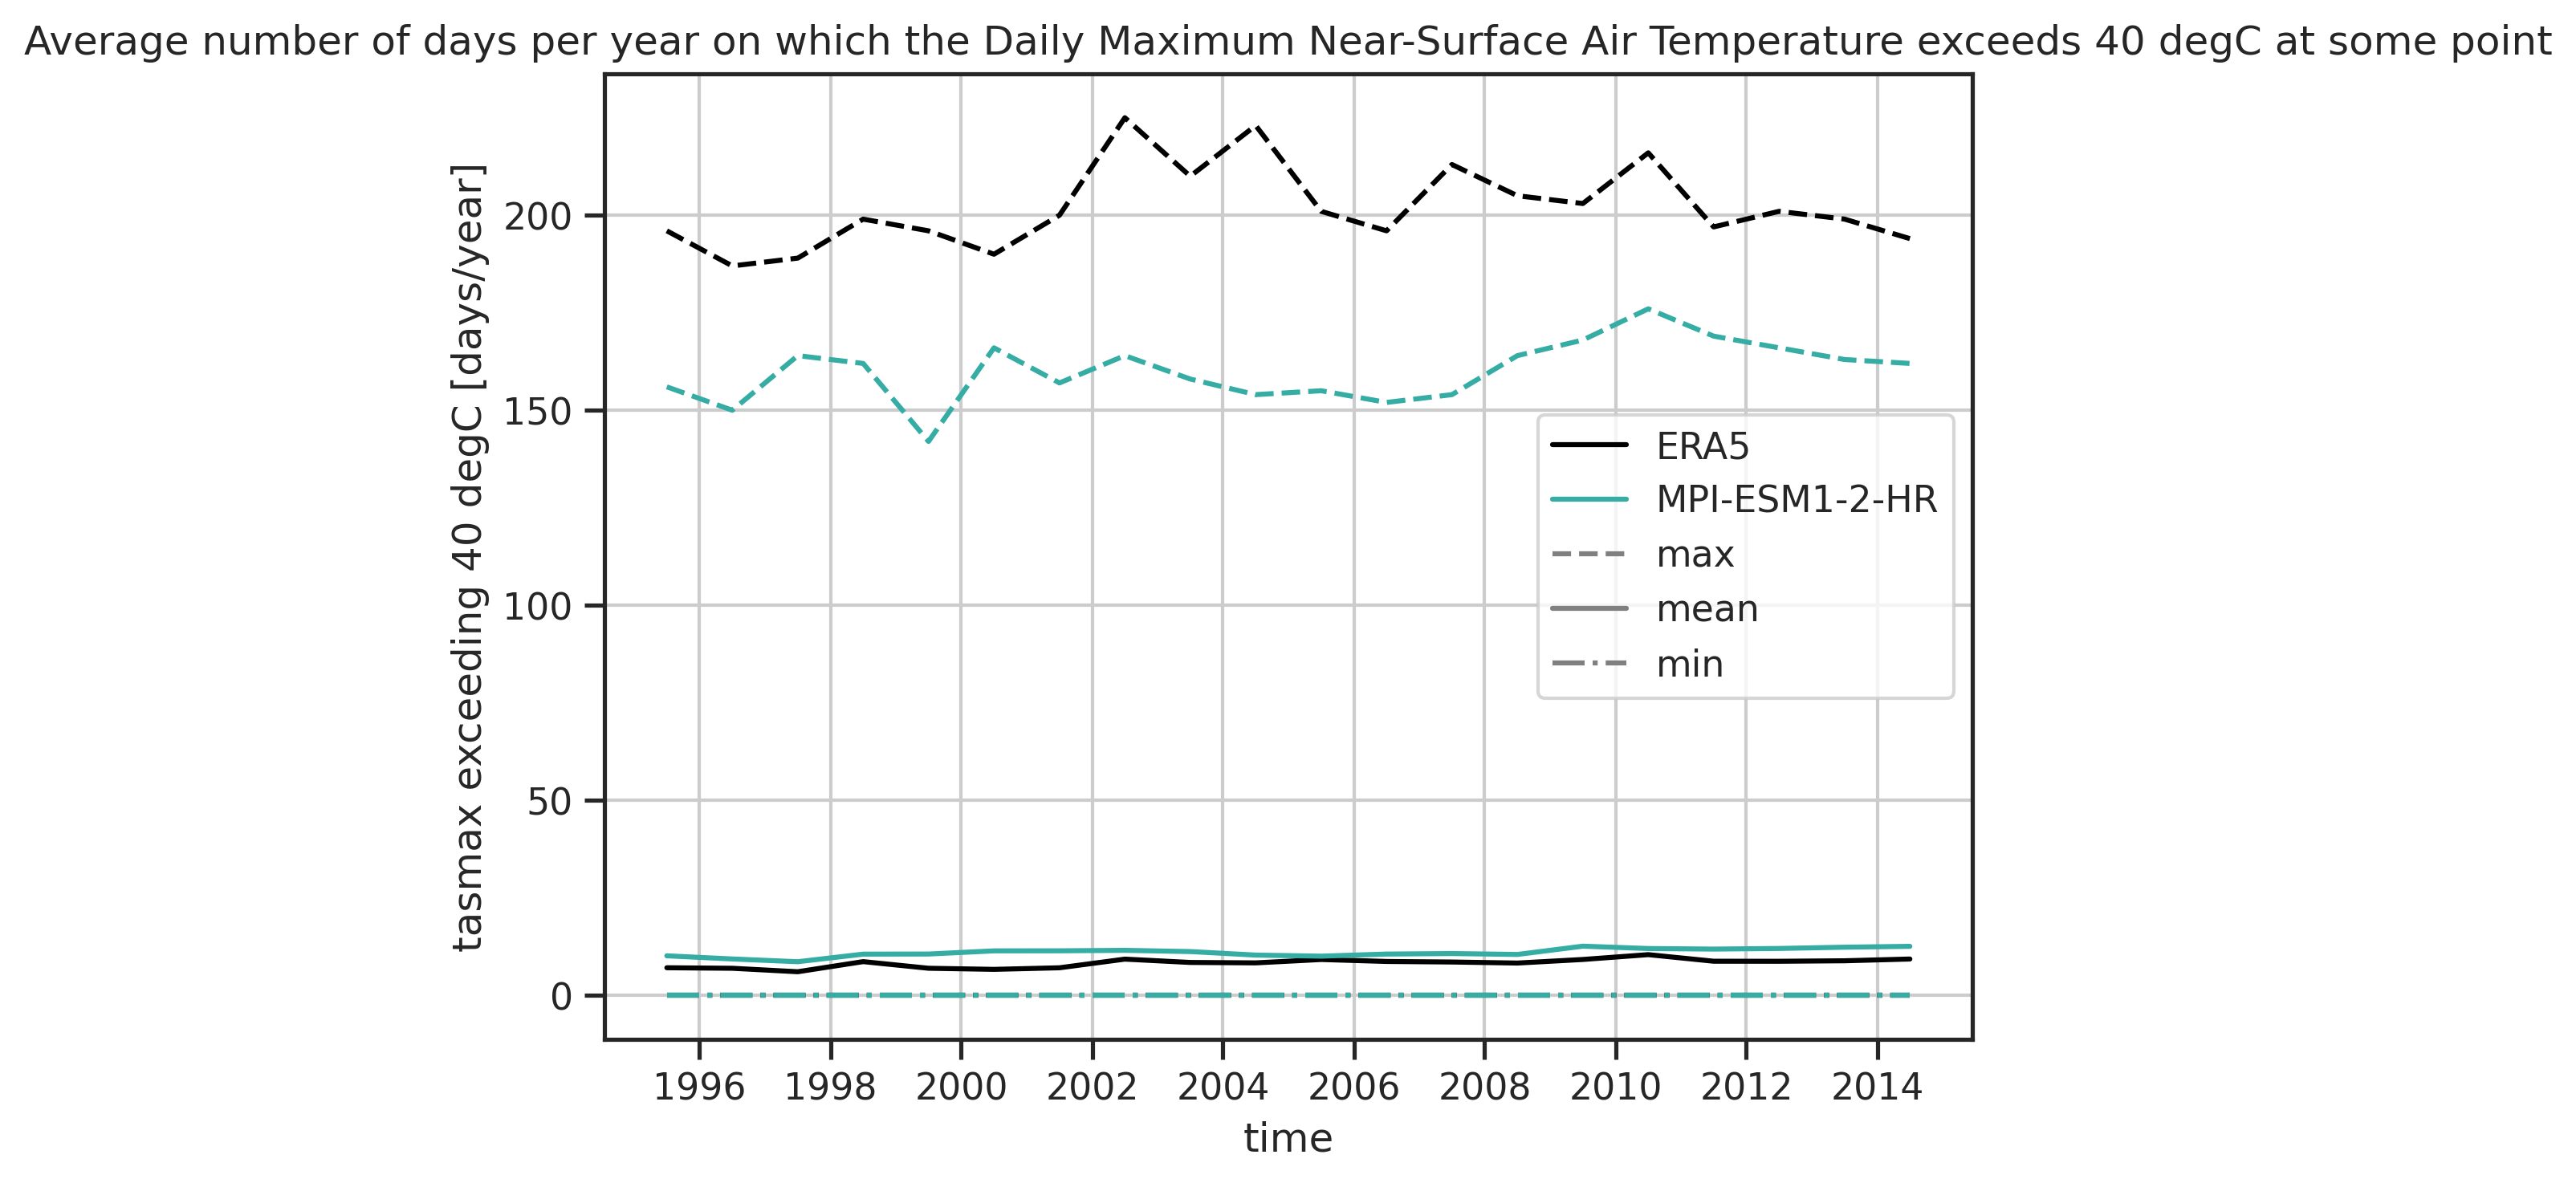
Fig. 386 Global climatology of the number of days on which tasmax exceeds 40°C.#
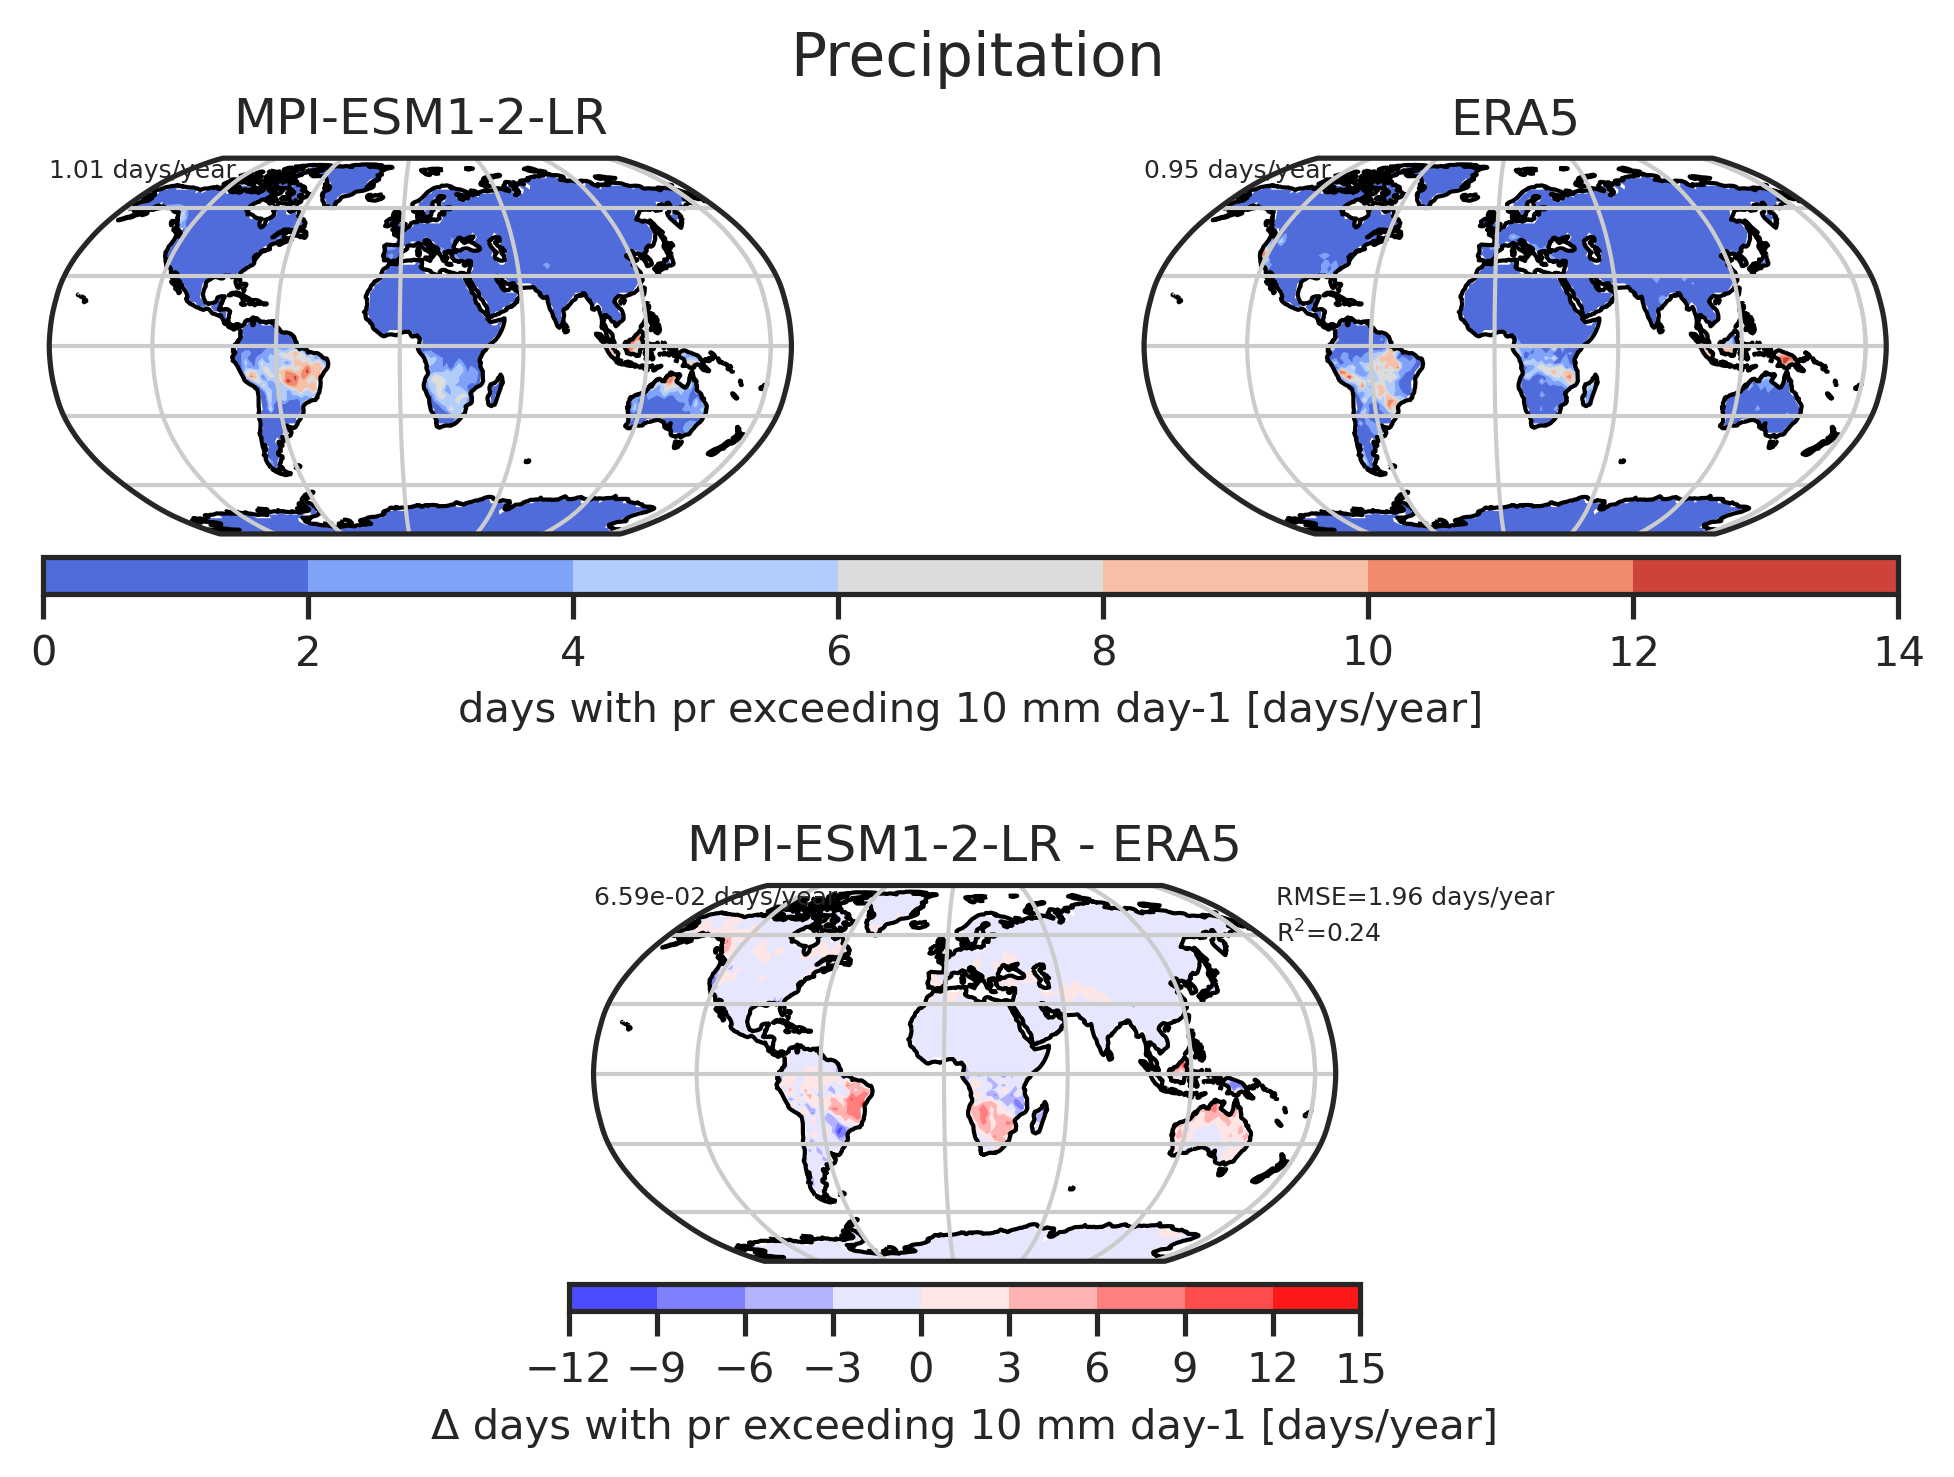
Fig. 387 Global map of the average number of days per year on which the precipitation exceeds 10 mm.#